
Route 9 Data Trends

This page captures key transportation, demographic/socioeconomic, and population health data trends along the Route 9 Corridor. The “study area” is Route 9 between the City of Wilmington and the City of New Castle. Unless otherwise noted, it encompasses the following Census tracts: 151, 154, 155.02, 156, 158.02, 159, and 160.
Demographic, Socioeconomic, and Health Trends
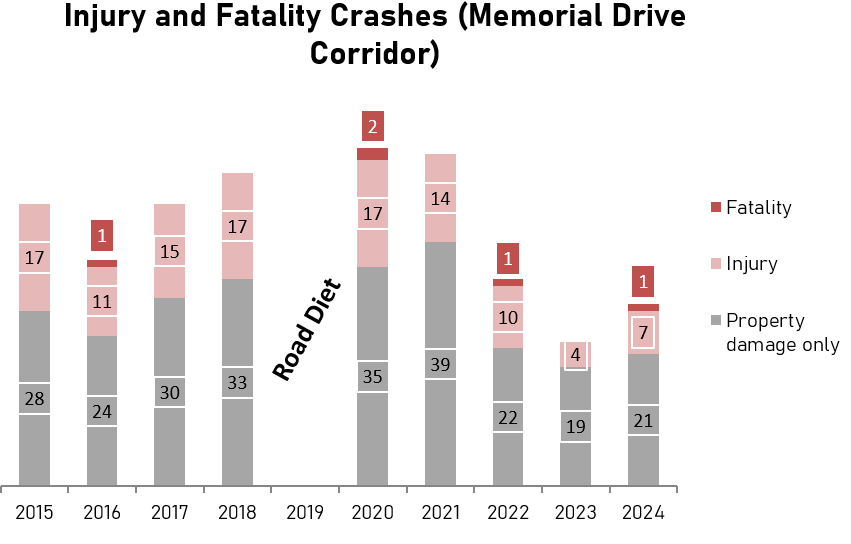
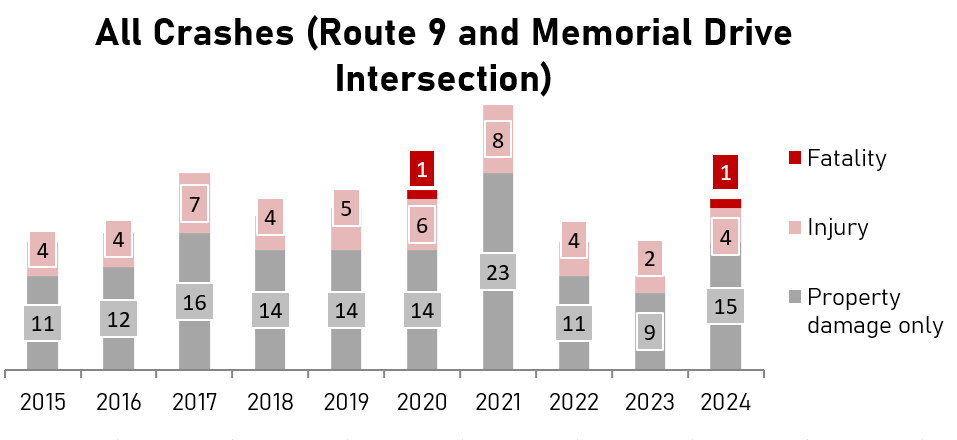
Crashes
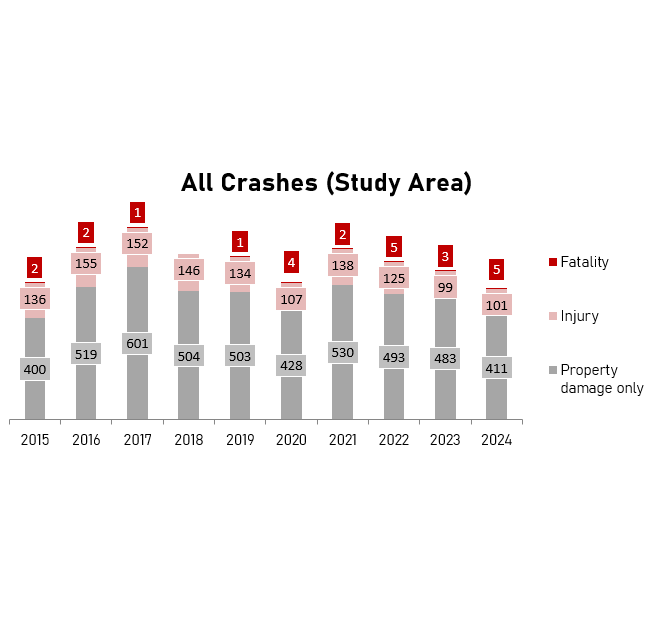
The study area spans south from Buttonwood Avenue, north to Terminal Avenue, west to North Dupont Highway, and east to the Delaware River.
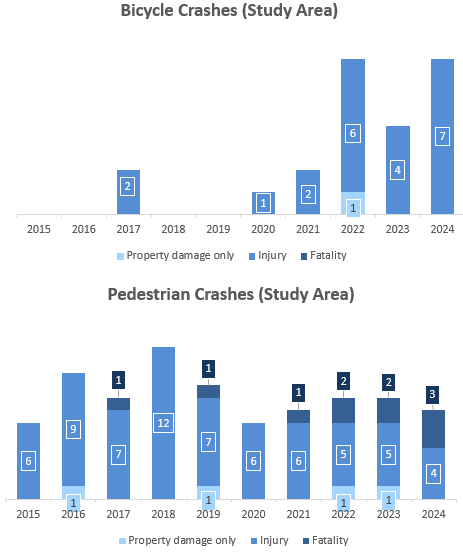
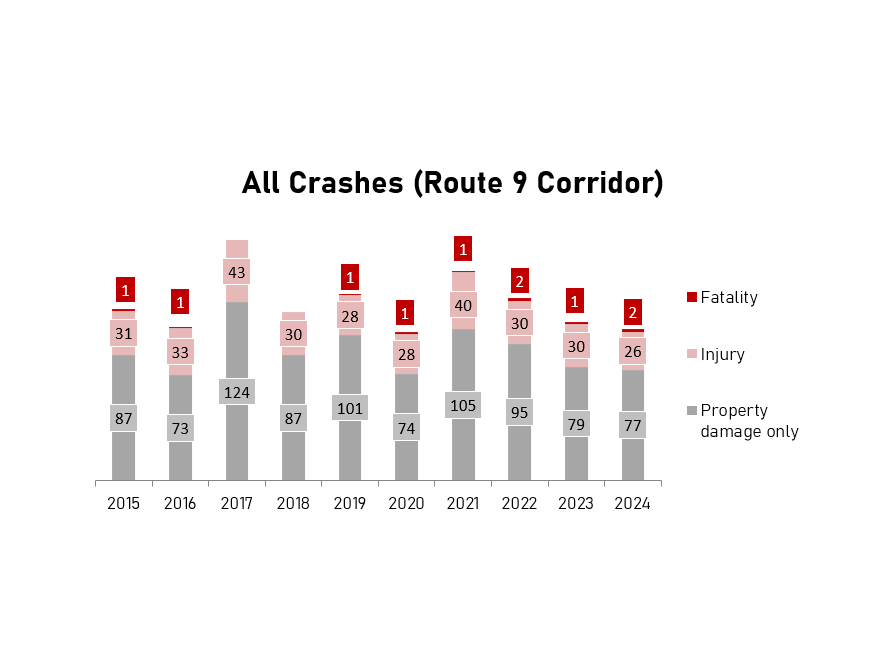
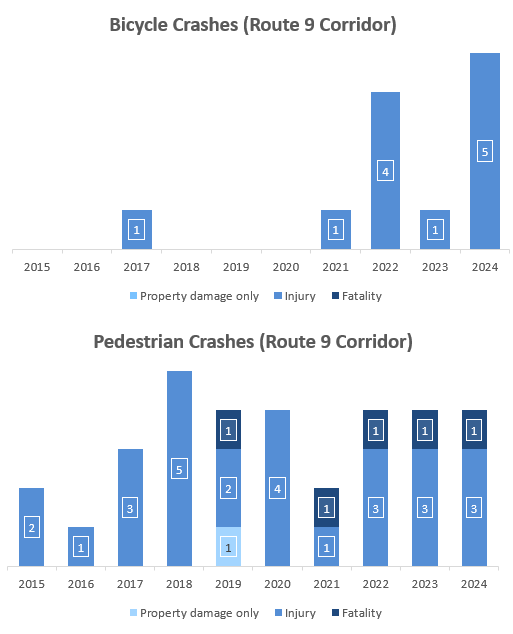
These data include crashes on Route 9 from Buttonwood Avenue to Terminal Avenue, with a 50-foot buffer on each side.
Traffic Trends
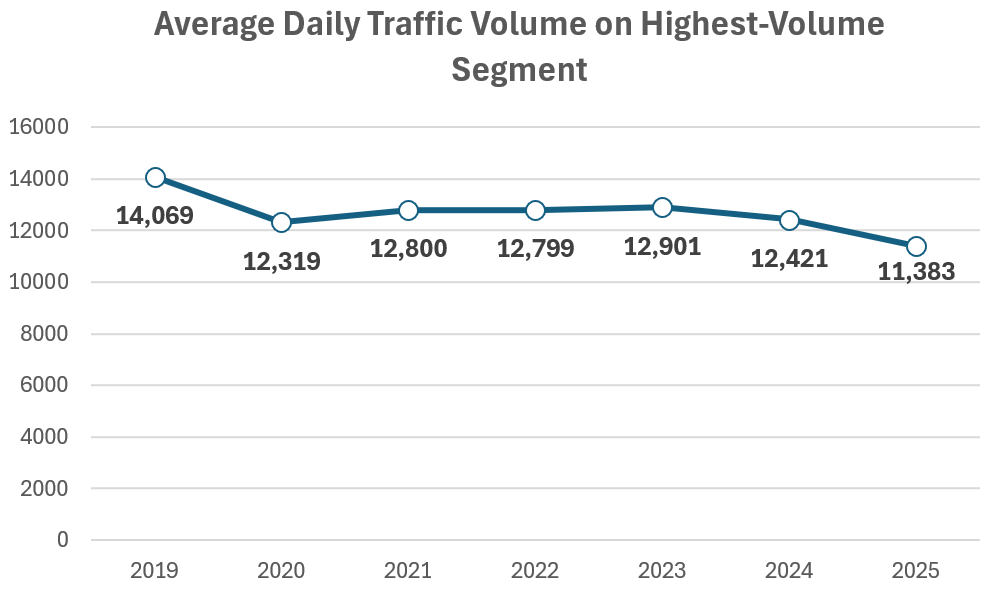
The highest volumes were consistently found on southbound New Castle Avenue just before the I-295 on-ramp.
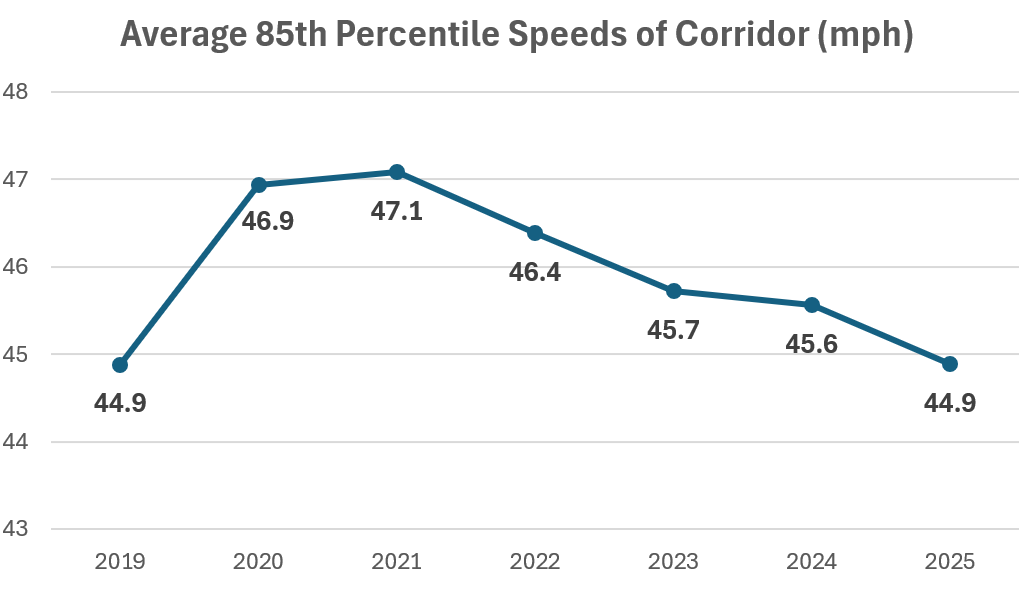
85th percentile speeds represent the speeds at or below which 85% of drivers are traveling. This excludes the fastest 15% of drivers.
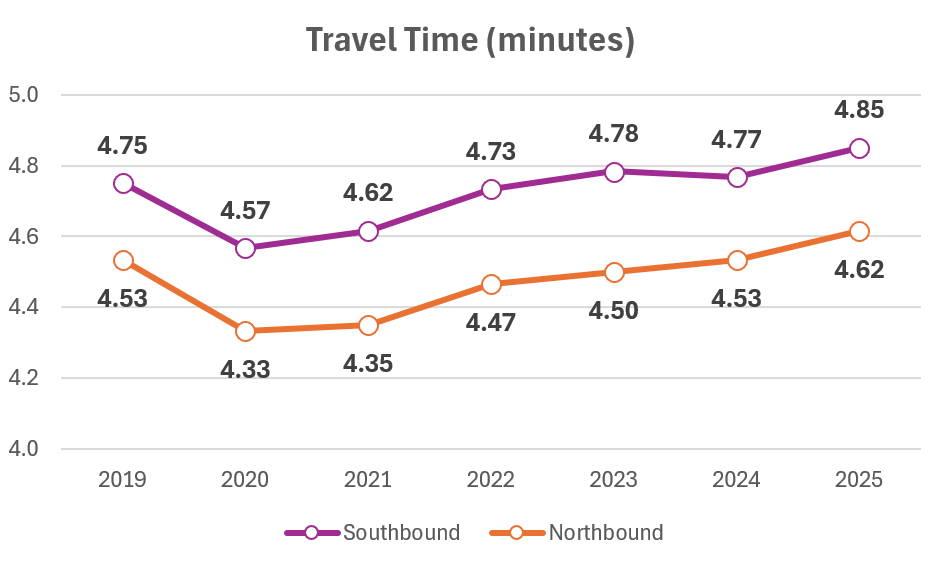
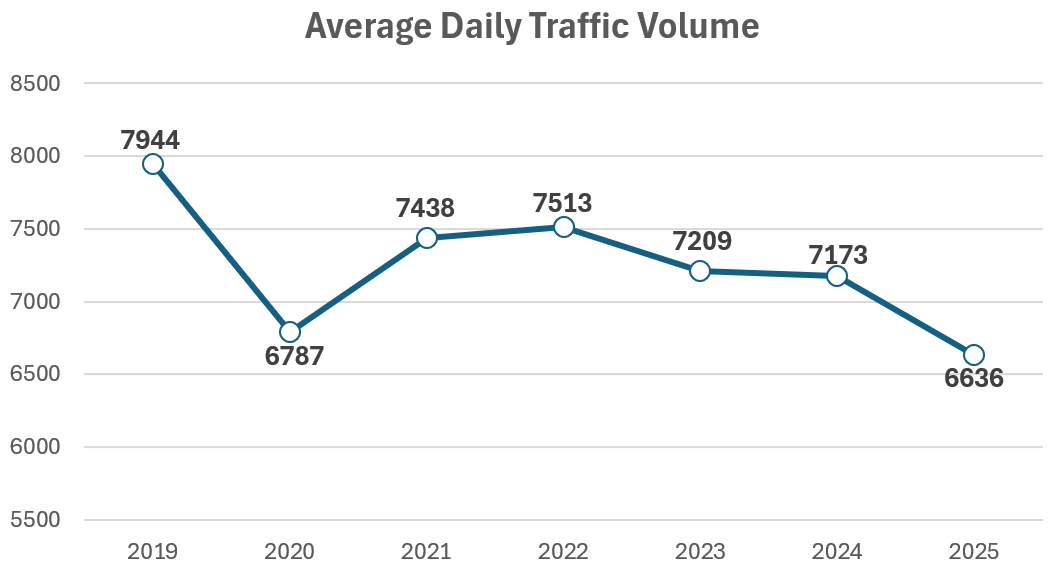
These traffic data follow SR 9 from Buttonwood to Eden Park.
Traffic data is sourced from Streetlight network performance analysis, completed for years 2019-2025.
Commute Mode
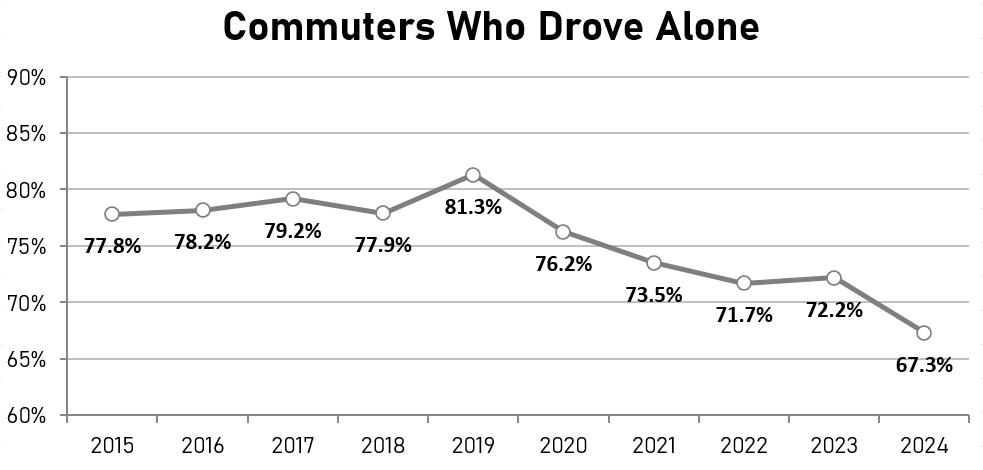
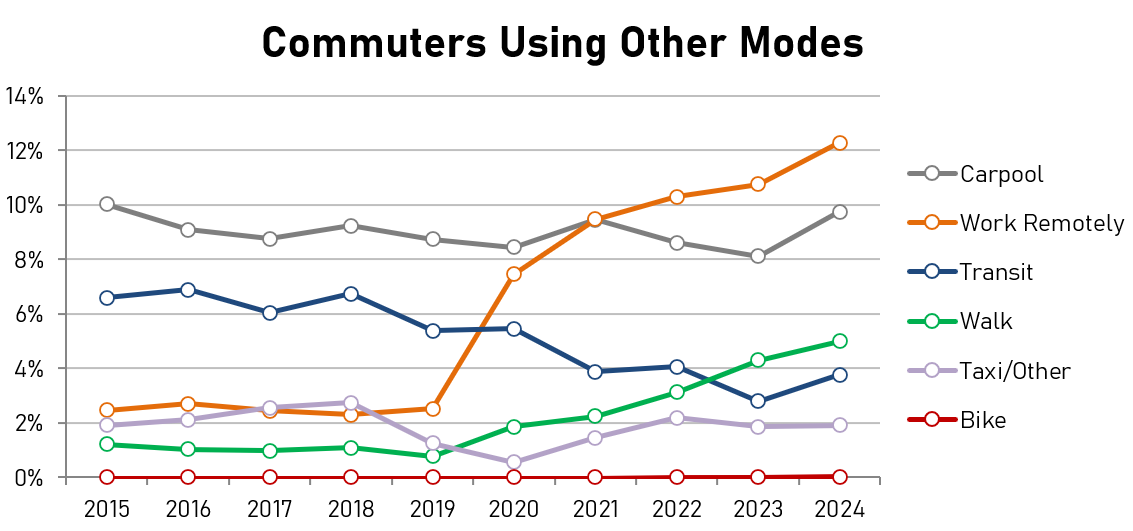
Commute to work values come from American Community Survey 5-year estimate “Journey to Work” datasets.