
Sidewalk Gap Analysis and Prioritization
About the Plan
WILMAPCO developed the Sidewalk Gap Analysis for Cecil County, Maryland and New Castle County, Delaware. This project combined data-driven analysis with community insight to better understand and address where sidewalks are missing—and how filling those gaps can improve walking in our community. Working with communities across the region, we explored:
- Where sidewalk gaps are located, and how they relate to where people walk or might want to walk
- How different types of gaps affect accessibility, safety, and comfort for people of all ages and abilities.
- Practical strategies to prioritize and fund investments to fill the gaps.
Stakeholder Information
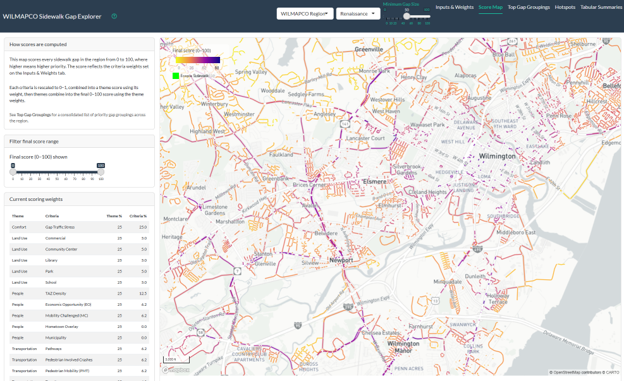
- Sidewalk Gap Explorer
- Maryland funding resources
- Delaware funding resources
- Transportation Alternatives Program
- Community Transportation Fund – contact your state elected officials
- Elkton Bridge Street Workshop: March 19, 2026 – Presentation, Fieldwork Information
- North Dupont Rd & Lancaster Pike Workshop: April 6, 2026, 1:00 – 3:30 p.m., Cab Calloway School Library, 100 N Dupont Rd, Wilmington, DE 19807
- US 13, Dupont Highway Workshop: April 13, 2026, 1:30 – 4 p.m., Wilmington University, 320 N Dupont Hwy, New Castle, DE 19720, Audrey K. Doberstein room DAC 201
Get Involved
You can play an important role by adding your insights to work. Tell us about the places you notice gaps, damaged or blocked routes, challenging crossings, or safety concerns missing from the map.
If you would like a copy of the GIS to aid in your own planning, please let us know!
Key Findings
The region contains an estimated 4,353 miles of sidewalk gaps.
Across the region, 4,353 miles of sidewalk gaps were identified. Of these, 2,704 miles are in New Castle County, and 1,649 miles are in Cecil County. Because the inventory maps sidewalk presence based on a comprehensive roadway network, it identifies where a sidewalk is absent on a side where one would be expected.
Community input and field review verified the accuracy of the gaps inventory and added context.
A public WikiMap received 418 comments from residents, most often citing missing sidewalks as a walking concern. This community input confirmed gap locations and enriched the data with local context. In addition, targeted field review across more than 26 miles of roadway confirmed approximately 90-95 percent accuracy in the sidewalk inventory and gap assessment.
A high-ranking sidewalk gap is different from a project.
The framework is a screening and comparison tool: scores identify candidate locations for further review. They do not define final projects or replace field verification, engineering review, or local decision-making. Pilot community engagement and field review confirmed that moving a gap toward implementation requires community coordination and review of right-of-way, utilities, drainage, crossings and conflicts, lighting, transit stop access, and relationship to planned transportation or development projects. Therefore, filling sidewalk gaps will rely on multiple delivery pathways.
134 miles of sidewalk gaps emerge as highest-priority needs.
The study ranked all identified sidewalk gaps using a prioritization framework designed around four themes: Comfort, Land Use, People, and Transportation. These themes account for roadway stress, proximity to destinations, population and equity context, transit access, trail and pathway connections, modeled pedestrian activity, and pedestrian-involved crashes. This framework identified approximately 134 miles of higher-priority sidewalk gaps.
Higher-priority sidewalk gaps concentrate in more dense areas.
Higher-priority sidewalk gaps are concentrated in Center, Core, and Community Transportation Investment Areas identified in the 2050 Regional Transportation Plan. The prioritization framework places greater weight on factors associated with these areas, such as pedestrian demand and transit access. The prioritization framework did not yield any prioritized gaps with a score above 50 within Developing or Rural areas.
The estimated cost of filling all higher-priority gaps is approximately $134 million.
Planning-level costs illustrate the scale of need. Using an order-of-magnitude assumption of $1.0 million per mile, addressing the higher-priority gaps would cost approximately $134 million. Addressing the full 4,353-mile inventory would represent a roughly $4.35 billion investment. The full cost serves as a measure of regional scale rather than an active target.